How Can Real Time Analytics Dashboards Improve Incident Response?
Real-time dashboards speed every incident phase: spot failures sooner, scope user impact from traffic and status codes, diagnose faster and confirm recovery with data.
Customer Login
Login11 blog posts tagged with Incident Management.
How Can Real Time Analytics Dashboards Improve Incident Response?
Real-time dashboards speed every incident phase: spot failures sooner, scope user impact from traffic and status codes, diagnose faster and confirm recovery with data.
What Should an Analytics Dashboard Include for Uptime and Incident Monitoring?
A good uptime dashboard shows current status, uptime vs SLA, p50/p95 response times, active incidents, MTTD/MTTR, error codes, SSL/domain expiry and region health.
Which Monitoring KPIs Belong on an Executive Analytics Dashboard?
An executive monitoring dashboard needs 5-8 outcome KPIs: availability vs SLO, error budget left, customer-impacting incidents, MTTR trend, p95 latency and expiry risk.
Why Do Teams Need a Unified Analytics Dashboard for Infrastructure Monitoring?
A unified dashboard puts uptime, SSL, domain, network and traffic data in one place, cutting context switching, duplicate alerts and slow correlation during incidents.
How Can AI Monitoring Reports Reduce Alert Fatigue for DevOps Teams?
AI monitoring reports cut alert fatigue by grouping correlated alerts into incidents, flagging noisy monitors, and moving low-severity signals into a scheduled digest.
How Can AI Reports Turn Raw Monitoring Data Into Actionable Incident Insights?
AI reports normalize check results, baseline them, detect anomalies and correlate alerts into one timeline with likely cause, business impact and next steps to take.
What Are AI Reports in Monitoring Platforms and How Do They Save Time?
AI reports turn uptime, latency, SSL, API and incident data into written summaries with anomalies and root-cause hints, cutting hours of weekly review and reporting.
What Should a Good AI Report Include After an Uptime or API Incident?
A good AI incident report covers impact, a detection-to-resolution timeline, correlated signals, likely root cause with confidence and evidence, unknowns, and actions.
Which Monitoring Use Cases Benefit Most From AI Generated Reports?
AI reports pay off most for multi-signal incidents, SLA reporting, slow performance drift, SSL and domain portfolios, third-party APIs, and agencies with many clients.
Why Do AI Reports Matter for Root Cause Analysis and Executive Summaries?
AI reports turn the same monitoring data into evidence-based root-cause hypotheses for engineers and plain-language impact summaries for leaders, cutting time to clarity.
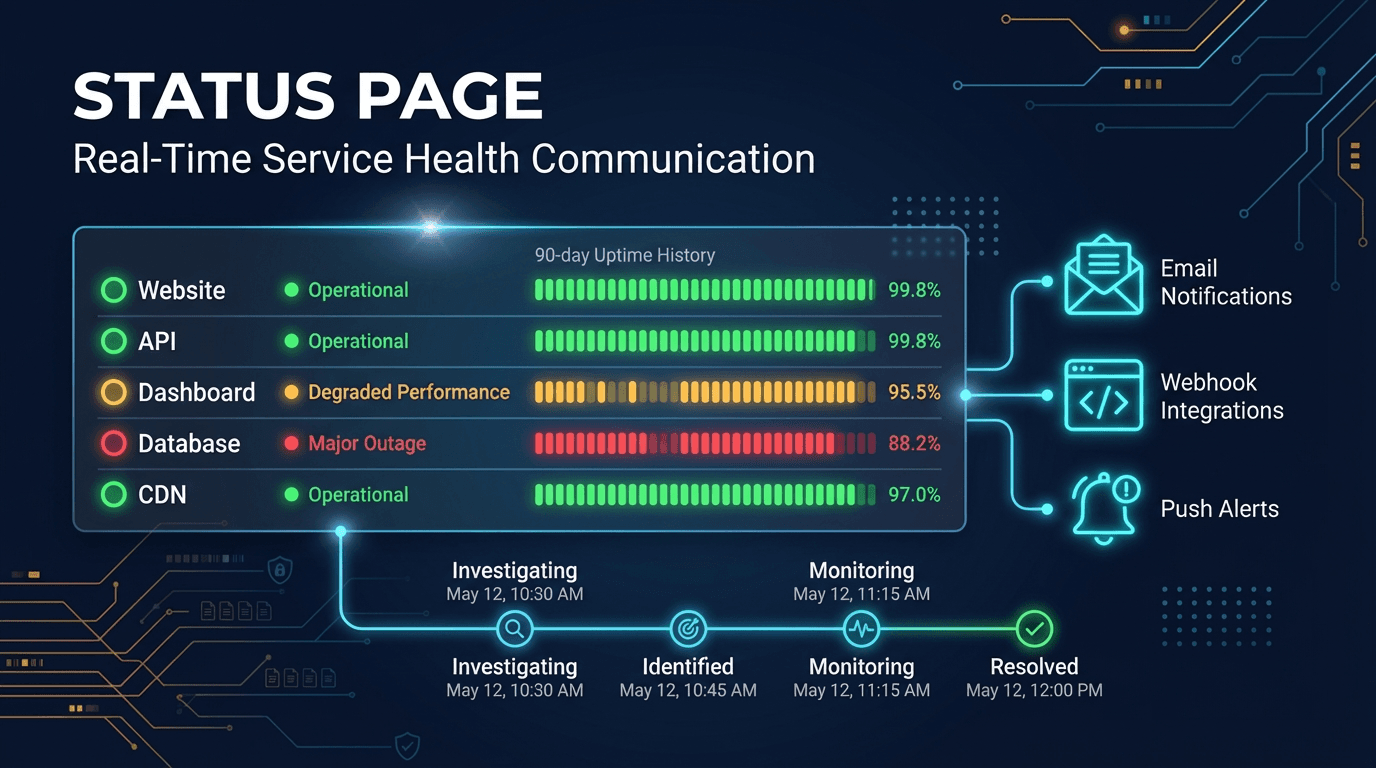
Status Pages: Real-Time Service Health Communication for Your Users
Complete guide to public status pages — branded service health dashboards with real-time component status, automated incident updates, 90-day uptime history, and subscriber notifications.
This Incident Management hub groups the latest UpScanX articles so you can go from curiosity to implementation without digging through the full archive. Page 1 lists up to 20 of 11 posts on this topic.
Most teams do not fix reliability with a single check. It takes clear ownership, useful alerts, trend analysis, and linking technical signals to user impact. That is why focused topic pages stay valuable over time.
Reading several angles on the same topic helps you compare approaches—whether you are improving uptime, reducing alert noise, hardening security, or scaling operations.
The strongest posts emphasize practical systems, measurable trade-offs, and repeatable habits: what to monitor, how to alert, how to prevent downtime, and how engineering choices affect business outcomes.
Use this page as a lightweight learning path: start with the article closest to your problem, then explore related guides.